
Check out our latest blog: "eBPF Decoded: Use Cases, Concepts, and Architecture"
Learn MoreCheck out our latest blog: "eBPF Decoded: Use Cases, Concepts, and Architecture"
Learn More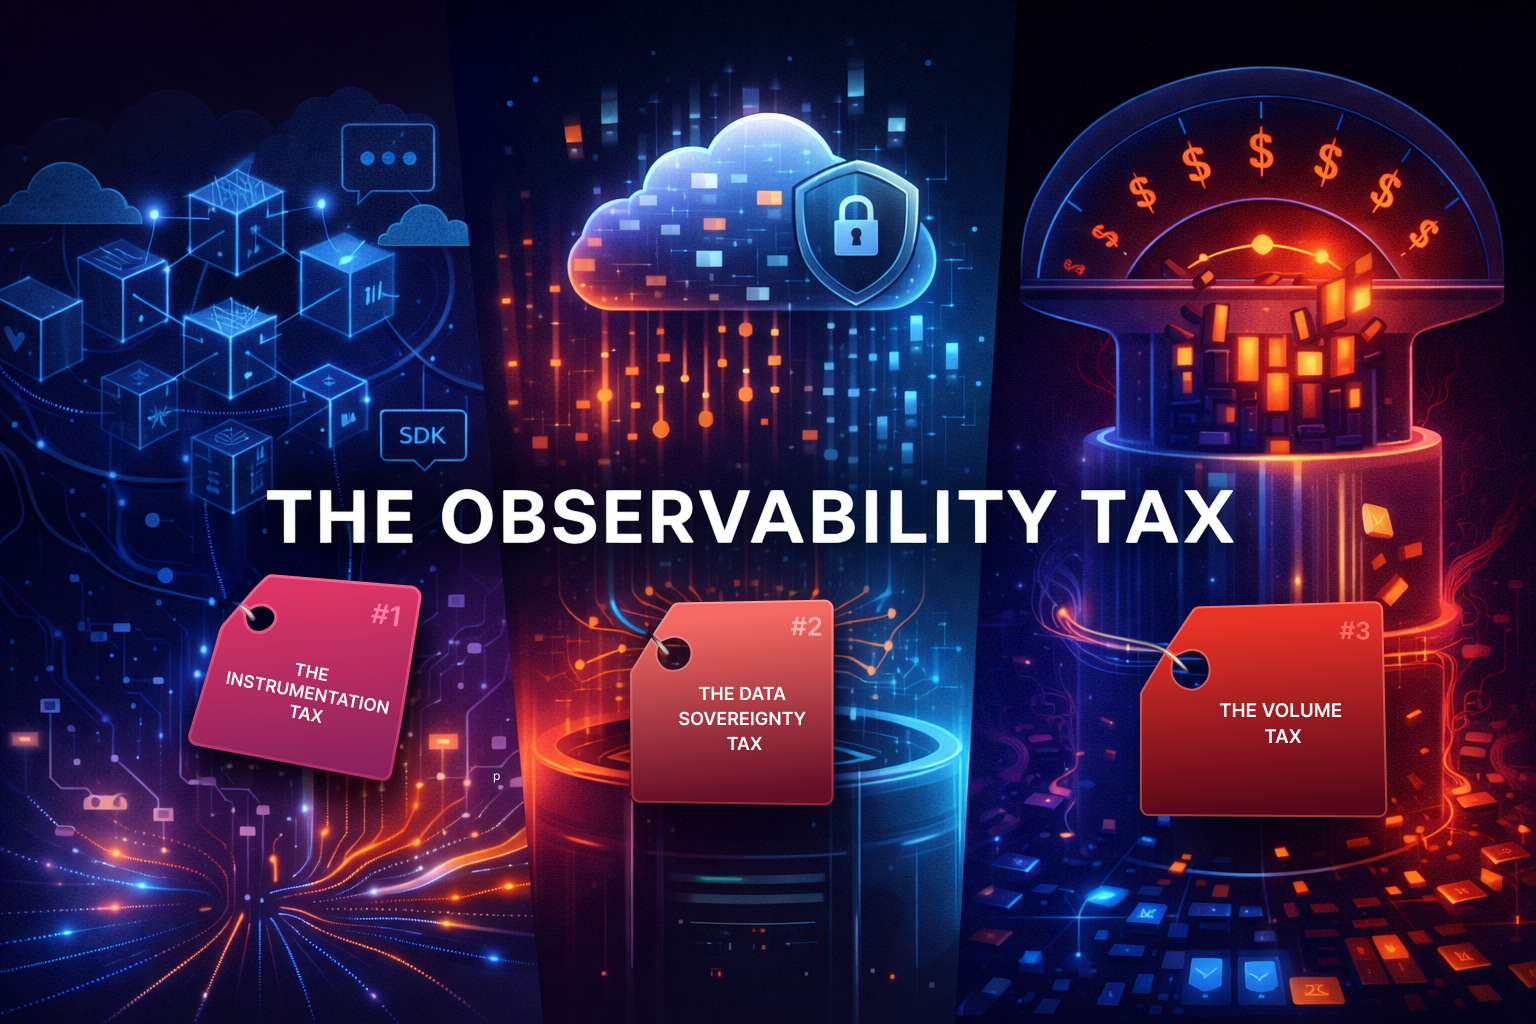

Founder & CEO
April 16, 2026
Modern observability has a design flaw.
It charges you more when your system works harder. It asks you to instrument every service before it becomes visible. And it requires you to hand your most sensitive operational data — traces, logs, request payloads, business signals — to a third-party cloud for the privilege of understanding your own software.
This isn't monitoring. It's a tax on running a successful application. Every team running modern infrastructure — Kubernetes, microservices, serverless, hybrid stacks — is paying some version of it. Most teams have stopped noticing, because the tax has been the default for so long.
KubeSense was built to end it.
Tax #1 — The Instrumentation Tax
Legacy APM tools require language-specific SDKs, sidecars, or agents inside every service. A team running fifty microservices across three languages has fifty integration points to install, test, upgrade, and debug. Every new service is blind until it's instrumented. Every language runtime upgrade risks breaking your telemetry pipeline. Every deployment gets heavier. Every engineer has opinions about whose job this is.
This isn't observability. It's integration maintenance dressed up as observability, and it scales with your team's misery rather than with your system's complexity.
Tax #2 — The Data Sovereignty Tax
Most observability platforms are SaaS-only. That means your traces — which often contain request payloads. Your logs — which often contain user data. Your metrics — which reveal your traffic patterns, your business cycles, your architectural choices. All of it leaves your perimeter and lives in someone else's cloud, under someone else's retention policy, behind someone else's security controls.
For teams in regulated industries — fintech, healthcare, public sector — this is an immediate compliance burden and often a dealbreaker. For everyone else, it's a slower-burn problem: the raw operational DNA of your systems is outside your control, and you're paying egress fees for the privilege.
Tax #3 — The Volume Tax
This is the most distorting of the three.
Legacy observability tools price by volume — per GB ingested, per host monitored, per custom metric, per million spans. The model creates a perverse incentive. The more you observe, the more you pay. So teams sample traces. They drop logs. They reduce metric cardinality. They don't monitor non-production environments. They negotiate quarterly bill reviews with finance.
The result: engineering teams end up with less visibility exactly when they need more — during growth, during incidents, during the launch of a new service. The tool's pricing model is working against the team's purpose.
KubeSense is built on three foundational decisions. Each one directly removes one of the taxes above.
eBPF at the kernel level — zero code changes, ever
Instead of asking your application to report on itself, KubeSense watches the kernel.
eBPF (extended Berkeley Packet Filter) allows lightweight programs to attach to kernel-level hooks — system calls, network events, function entry points — and capture traces, metrics, and network traffic at wire speed with negligible overhead. You deploy a single sensor (KubeSensor) per node. Within minutes, every service communicating over the network is auto-discovered, and every request across 25+ protocols — HTTP, gRPC, PostgreSQL, MySQL, Redis, MongoDB, Kafka, RabbitMQ, Cassandra, Elasticsearch, DNS, and more — is captured automatically.
No SDKs. No sidecars. No code changes. No per-service configuration. No language-specific integrations.
eBPF works regardless of what language your service is written in — Java, Go, Python, Rust, Node.js, .NET, C++ — because it operates below the application layer. Your code doesn't know it's being observed, and it doesn't need to.
For teams already standardized on OpenTelemetry, KubeSense is OTel-native. OTLP traces, metrics, and logs are accepted natively, so kernel-level and application-level visibility coexist in a single pane of glass without vendor lock-in.
100% self-hosted — your data never leaves
The entire KubeSense platform — collection, processing, storage, and UI — runs inside your environment. Your AWS account. Your GCP project. Your Azure subscription. Your on-prem data center. Observability data is collected, processed, stored, and queried entirely within the boundary of your own infrastructure.
This design choice solves three problems at once.
Security. Your sensitive operational data never crosses your perimeter. Traces, logs, and metrics stay where they were generated. There is no vendor-side breach surface for your telemetry.
Compliance. GDPR, HIPAA, SOC 2, PCI-DSS, data residency requirements — all met by default, because nothing leaves. Compliance reviews for adopting observability stop being review cycles.
Economics. Zero data egress. Zero cross-region transfer fees. And complete control over retention — keep seven days or seven hundred, on storage you control, at costs you set.
Infrastructure-based pricing — monitor everything
Because KubeSense runs on your infrastructure, pricing is based on the infrastructure you monitor, not the volume of data you generate.
No per-GB charge. No per-span meter. No custom-metric tax. No surprise line items at the end of a heavy quarter.
The result changes team behavior. Engineers enable observability in dev, staging, and production — not just production. They keep full trace sampling. They retain logs for meaningful windows. They add cardinality when they need it. The tool stops fighting the team's purpose, and observability becomes something you do everywhere instead of something you ration.
From a single deployment, every capability below turns on together:
APM and distributed tracing. Every service auto-discovered with success rate, RPS, P95/P99 latency, and end-to-end request tracing across all protocols.
Service map. Real-time visualization of every service dependency, connection health, and traffic flow — discovered automatically, updated live.
Log management. Centralized search, filtering, and transformation pipelines with SPL, a built-in search processing language for advanced analytics at petabyte scale.
Infrastructure monitoring. Nodes, pods, deployments, and 11+ Kubernetes resource types across EKS, GKE, AKS, OpenShift, ECS, Lambda, Docker, VMs, and on-prem — one dashboard.
Database monitoring. MySQL, PostgreSQL, Redis, and MongoDB query performance captured at the protocol level, without installing any database-side agents.
Real User Monitoring. Frontend crash rates, session replay, and performance metrics from mobile and web, correlated back to backend traces.
AgentSRE. An AI-powered SRE assistant that investigates incidents, performs root cause analysis, and answers questions about your infrastructure in natural language — with full context of your live observability data.
One install. One platform. Running inside your own cloud.
AgentSRE isn't AI bolted onto a legacy observability tool. It's an AI SRE designed around the data it has access to.
Ask "What are the top errors impacting my services right now?" and AgentSRE generates the precise query against your traces and logs, executes it, and returns a structured analysis with suggested follow-ups. Ask "Why is checkout returning 500s?" and it investigates across services, spans, infrastructure events, and recent deployments to narrow the likely root cause.
When you encounter a failed trace, AI Root Cause Analysis examines the full distributed trace — every span, every service hop, every database call — and returns a specific diagnosis with a remediation recommendation. Not generic advice. Not "check your logs." An actual, contextual answer based on your actual data.
The reason this works is architectural: AgentSRE sits directly on top of a complete, unsampled observability dataset that lives inside your own environment. It can see everything, because eBPF captures everything, and because nothing has been dropped for cost reasons.
Over the coming weeks we'll be publishing deep dives on each part of the platform — how eBPF auto-instrumentation works under the hood, how AgentSRE investigates an incident end-to-end, how log pipelines transform and enrich at petabyte scale, and how the platform replaces three or four separate tools with one.
If you're a platform engineer, SRE, or engineering leader who's tired of the observability tax — KubeSense was built for you.

Tags